Gain a comprehensive view of purchasing performance and supplier fulfillment with key metrics and trends across your procurement operations. Monitor total and open purchase order value, track fill rates and supplier lead times, analyze PO status distribution, and identify vendor performance patterns. Stay informed on operational activity through ordered and partially received purchase orders, while proactively managing upcoming deliveries with expected receipts scheduled for this week. The Purchase Order Metrics page provides actionable insights to improve procurement efficiency, supplier reliability, and inventory planning.
Explore the following topics about Purchase Order Metrics:
Access Purchase Order Metrics
To view Stock Metrics;
-
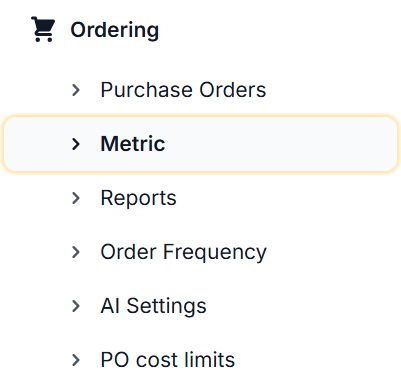
From the Dashboard, navigate to the left-hand side of the menu and select Ordering, then select Metric
-
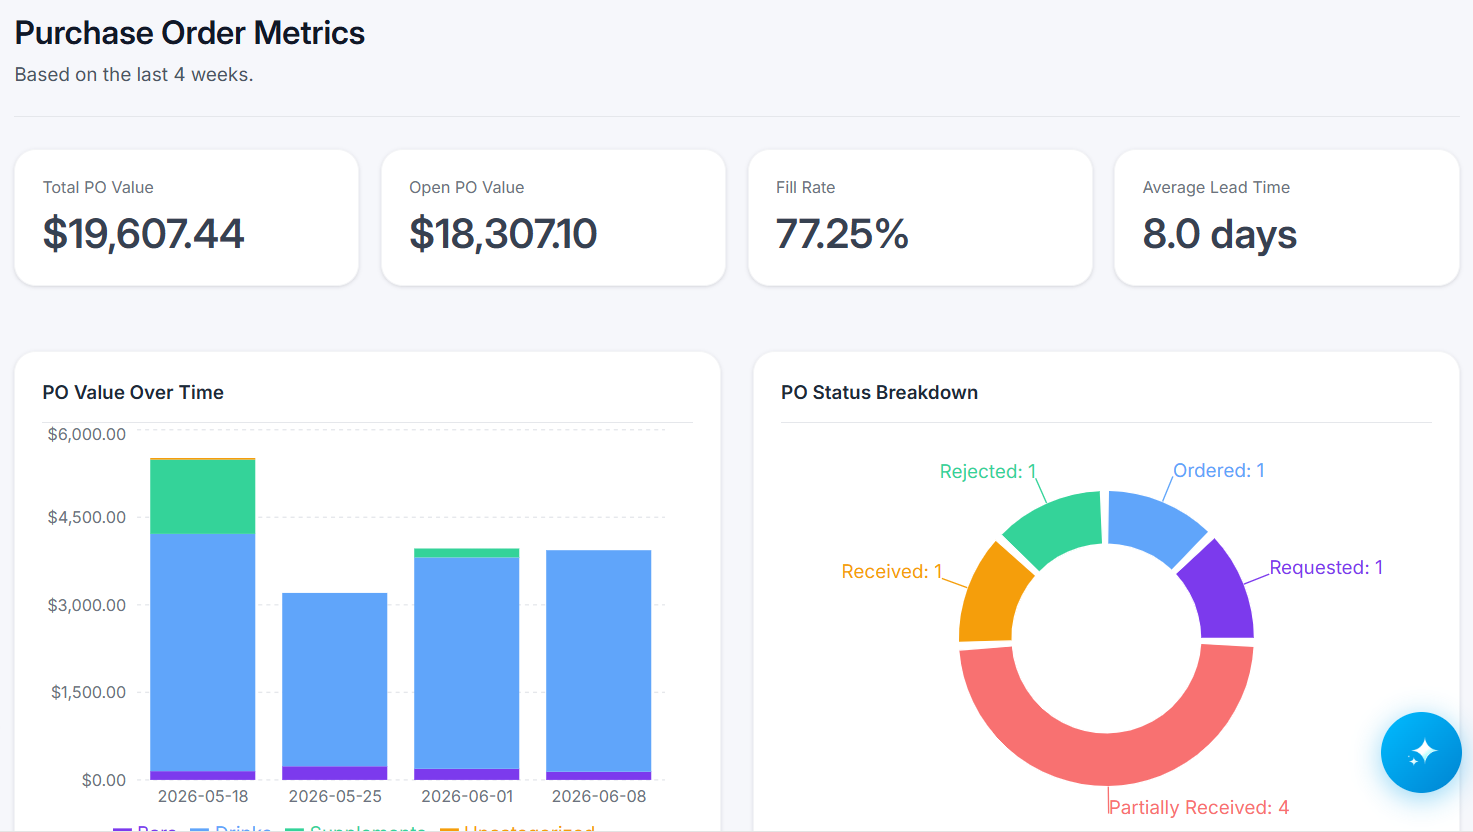
A dashboard similar to the one below will display;

Purchase Order Metric Breakdown
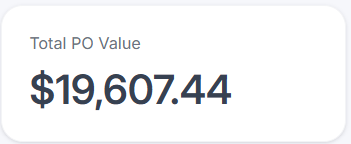
Total PO Value
Displays the total value of purchase orders created during the last 4 weeks, providing visibility into recent procurement spending.
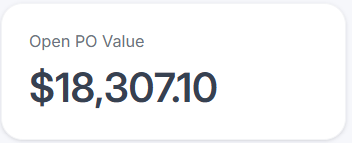
Open PO Value
Shows the value of purchase orders from the last 4 weeks that remain open or have not been fully received, helping track outstanding commitments.
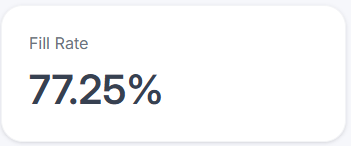
Fill Rate
Measures the percentage of ordered quantities received over the last 4 weeks, indicating recent supplier fulfillment performance.
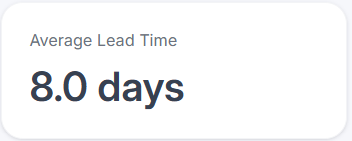
Average Lead Time
Represents the average number of days between purchase order creation and receipt for orders received in the last 4 weeks.
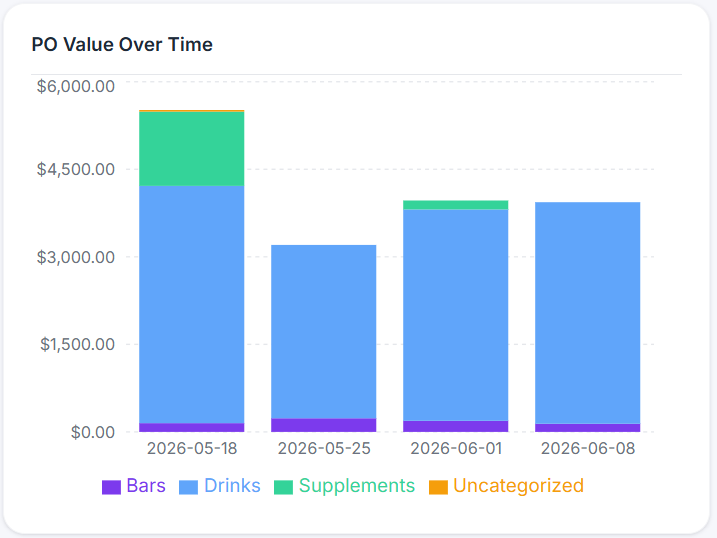
PO Value Over Time
Visualizes weekly purchase order value trends across the last 4 weeks, helping identify changes in procurement activity.
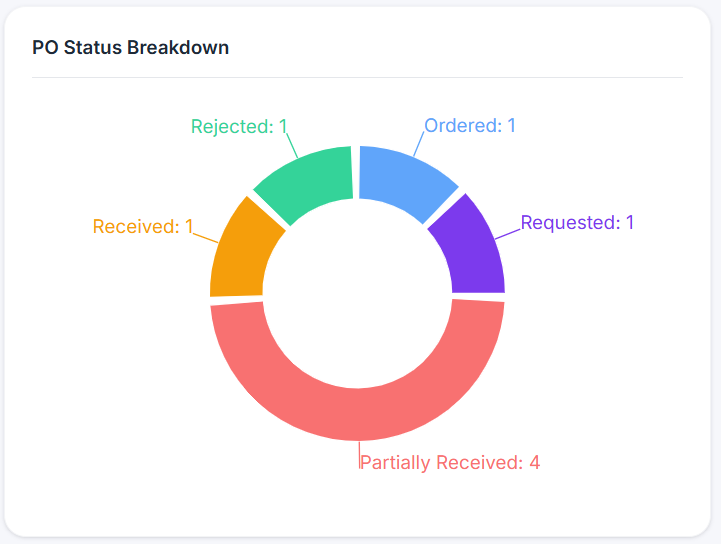
PO Status Breakdown
Provides a breakdown of purchase orders created in the last 4 weeks by status, offering a snapshot of current order progress.
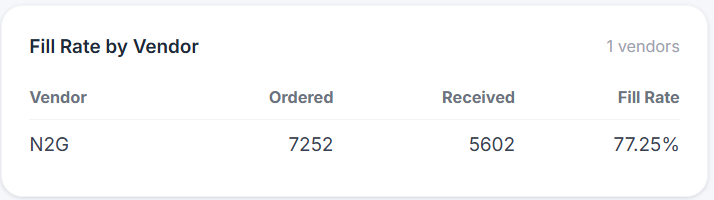
Fill Rate by Vendor
Compares vendor fulfillment performance over the last 4 weeks based on the percentage of ordered quantities received.
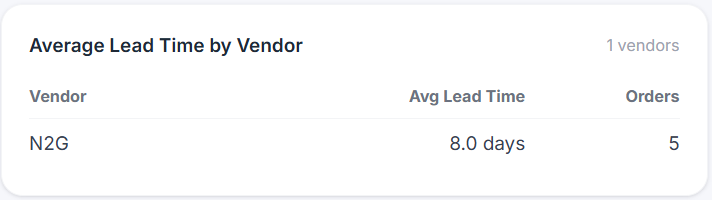
Average Lead Time by Vendor
Highlights supplier responsiveness by comparing average lead times for purchase orders received during the last 4 weeks.
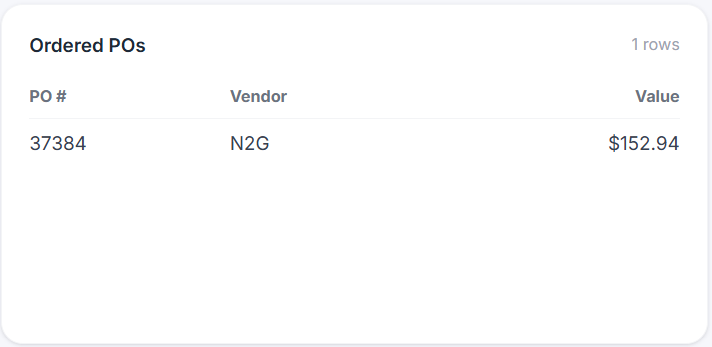
Ordered POs
Displays the total number of purchase orders created within the last 4 weeks, providing insight into recent purchasing activity.
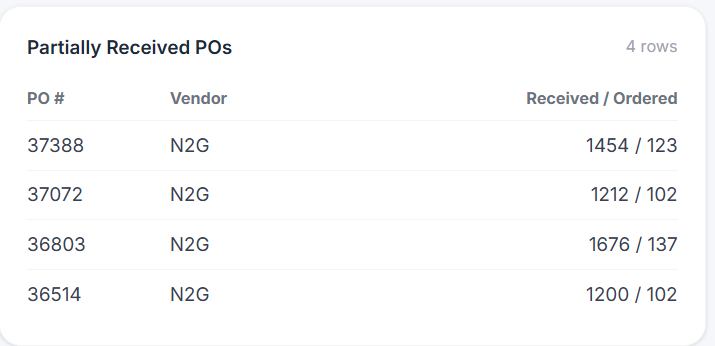
Partially Received POs
Shows the number of purchase orders from the last 4 weeks that have been partially fulfilled and are awaiting additional receipts.
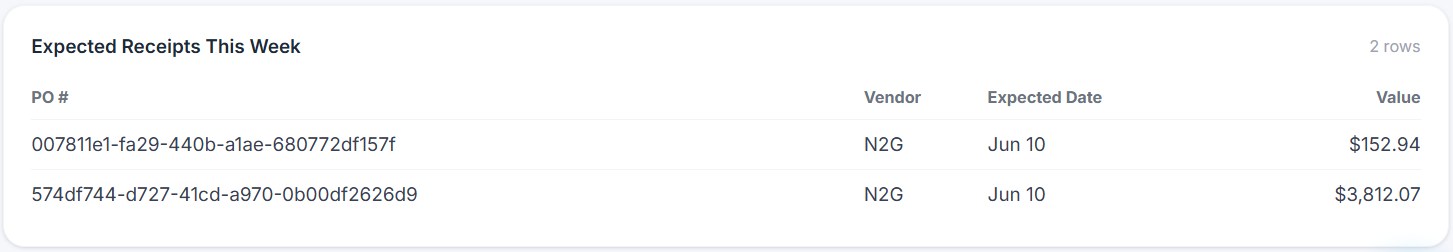
Expected Receipts this Week
Summarizes open purchase orders expected to be received during the current week, supporting short-term inventory and receiving planning.