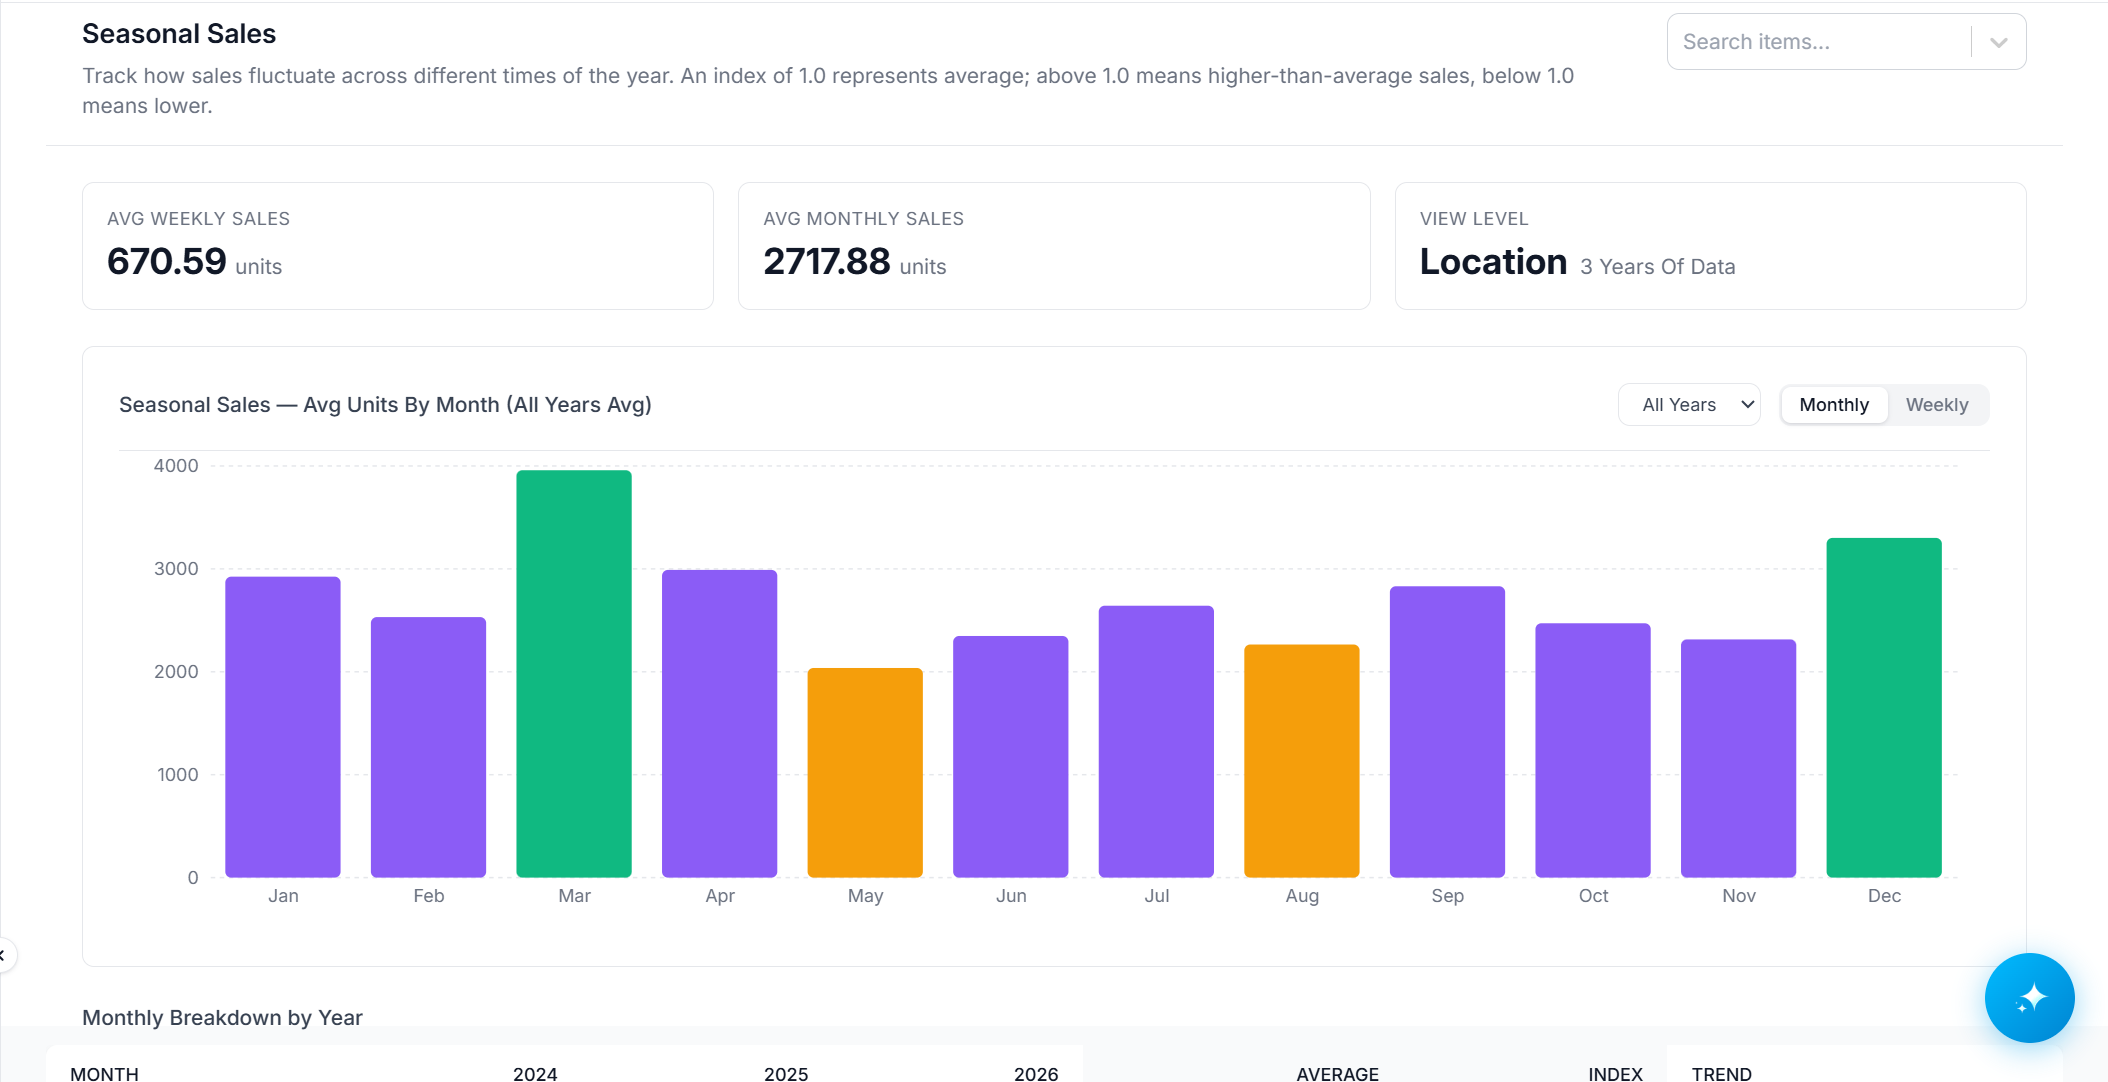
Vego Inventory allows users to track how sales fluctuate across different times of the year. By default, Seasonal Sales shows data for all items at a location based on 3 years of data, however, it can be filtered to show specific items or years.
Access Seasonal Sales
-
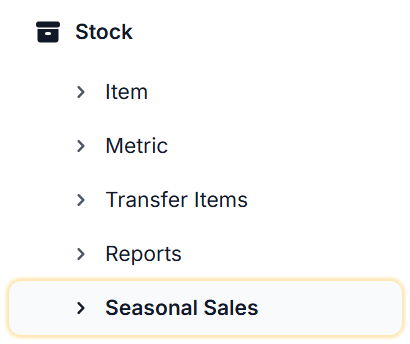
From the Dashboard, navigate to the left-hand side of the menu and select Stock, then select Seasonal Sales
-
A dashboard similar to the one below will display;
-
The following data is displayed on the Seasonal Sales dashboard;
-
AVG Weekly Sales
-
AVG Monthly Sales
-
AVG Units by (Month or Week) - All 3 years, or specific years
-

-

-

-
-
Monthly Breakdown by Year
-
Weekly Breakdown by Year
-
-
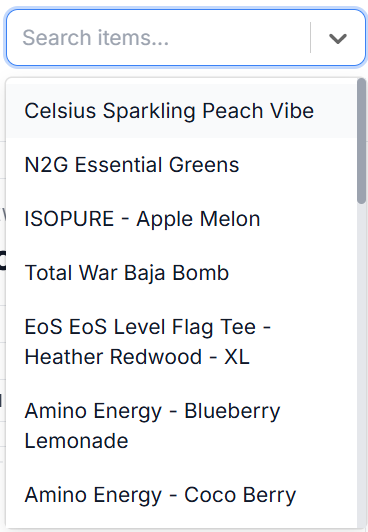
Seasonal Sales can also be filtered to show for specific items by selecting the Search Items dropdown on the top right of the page and entering an item to view.