Analyze inventory and sales performance over the last 4 weeks with key metrics that measure inventory value, revenue generation, and profitability. Monitor on-hand inventory value, gross sales, cost of goods sold, and gross profit alongside weekly sales trends to understand demand patterns. Identify products that may require attention through low-stock and excess-stock indicators, helping you optimize inventory investment, improve stock availability, and reduce carrying costs.
Explore the following topics about Stock Metrics:
View Stock Metrics
-
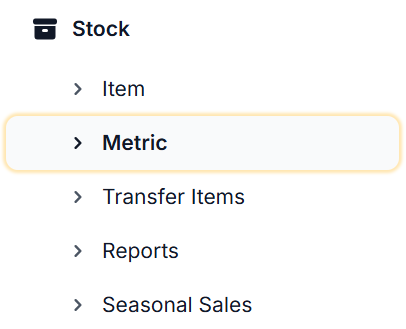
From the Dashboard, navigate to the left-hand side of the menu and select Stock, then select Metric
-
A dashboard similar to the one below will display;
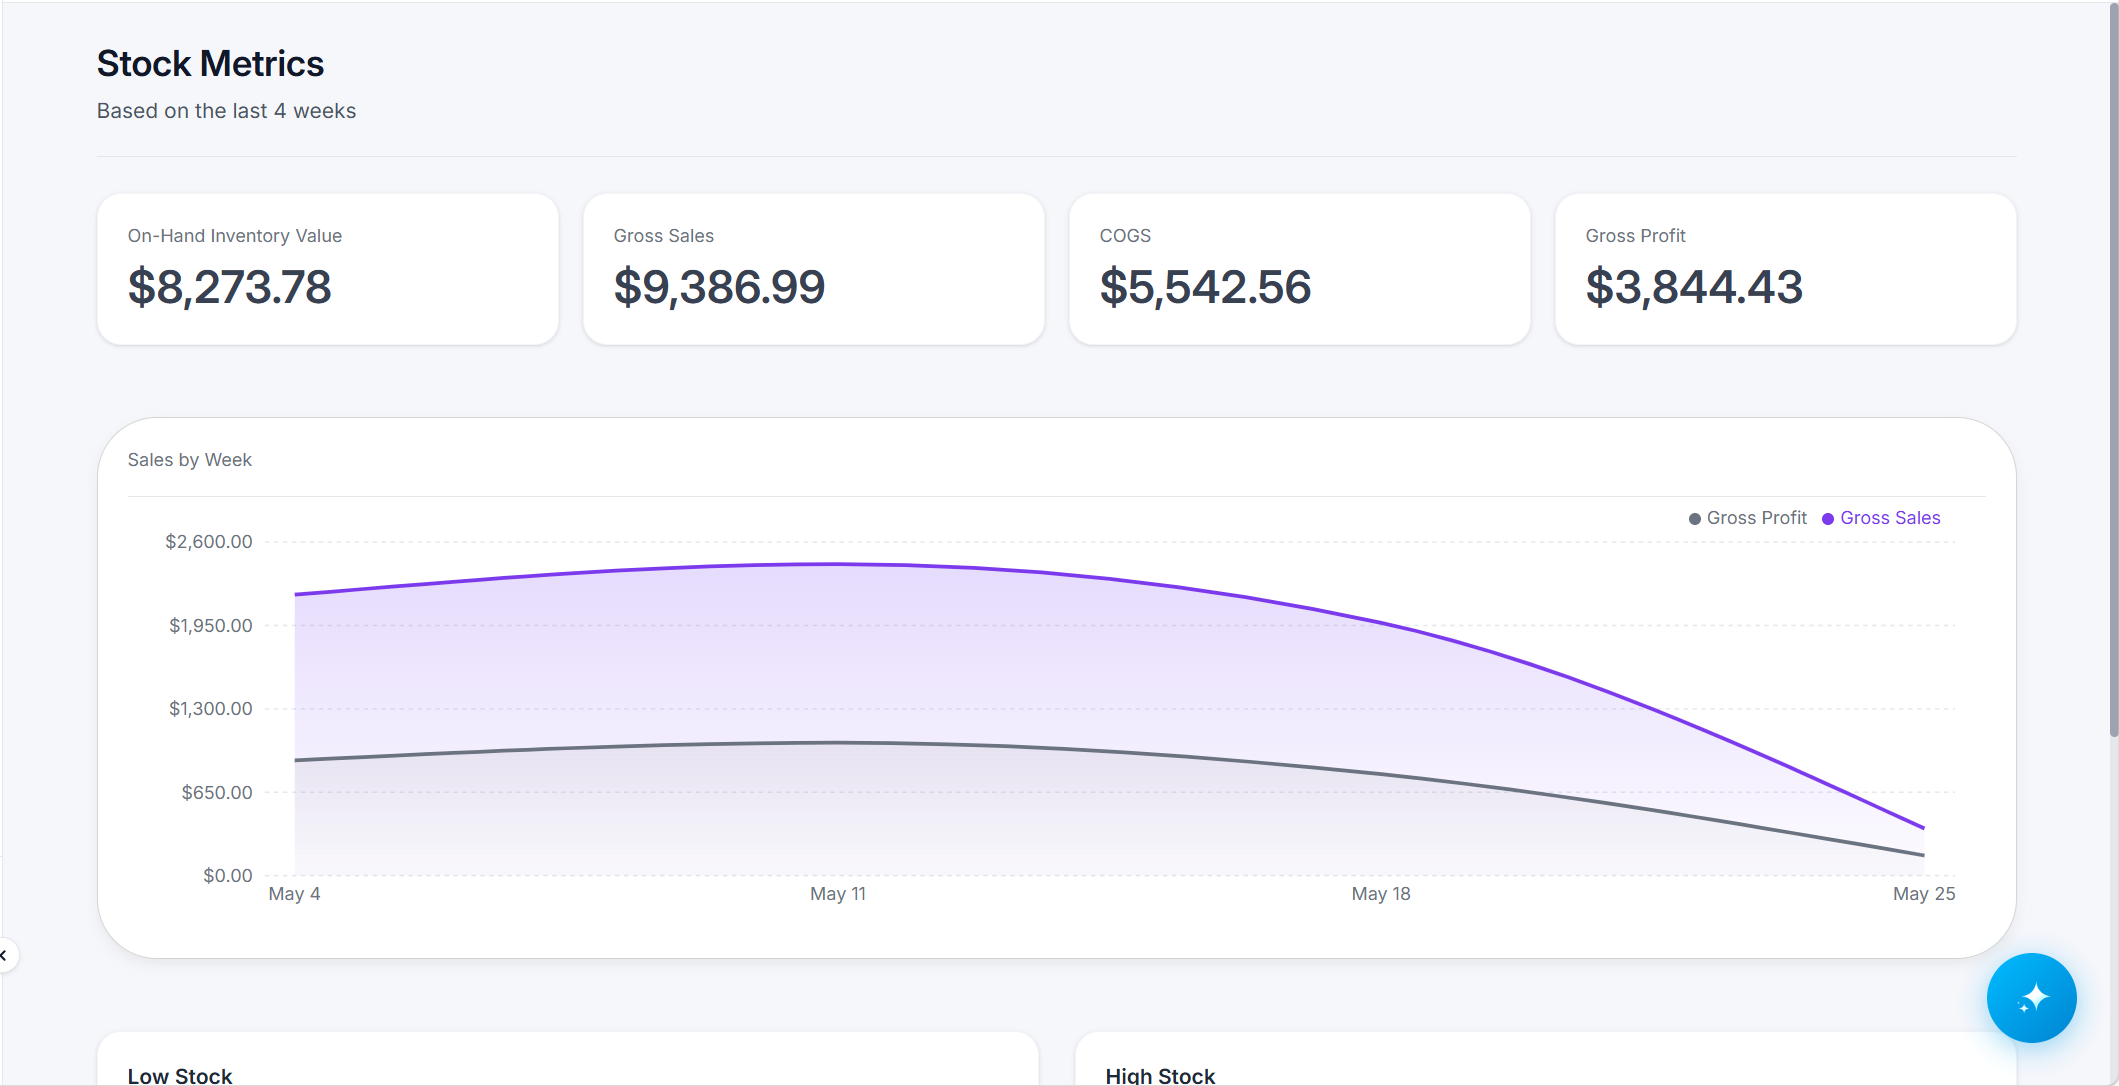
Stock Metric Breakdown
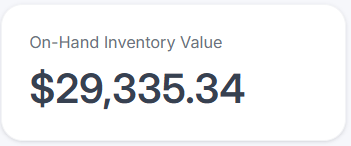
On-Hand Inventory Value
This metric measures the total cost value of inventory that is physically available for sale. By combining current on-hand quantities with their associated unit costs, it provides visibility into how much capital is currently tied up in inventory across your supply chain.
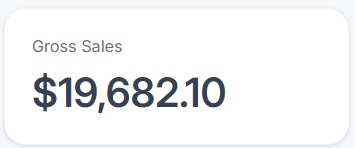
Gross Sales
Gross Sales shows the total value of all products sold within the last 4-weeks. It gives you a clear view of your overall sales activity so you can easily track how your business is performing over time.
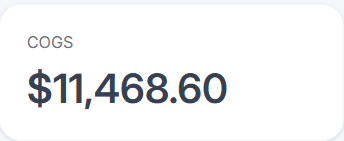
Cost of Goods Sold (COGS)
Cost of Goods Sold (COGS) shows the direct costs of purchasing the goods you sold during the last 4-weeks. This metric helps you understand true product-level profitability and is essential for tracking margins, pricing strategy, and inventory efficiency.
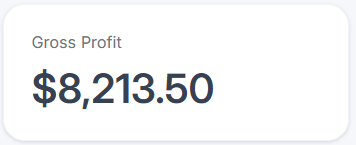
Gross Profit
Gross Profit shows how much money your business retains after subtracting the direct costs of goods sold from total revenue in the last 4-weeks. It reflects the core profitability of your inventory operations and helps you understand how efficiently products are being sourced, priced, and sold.
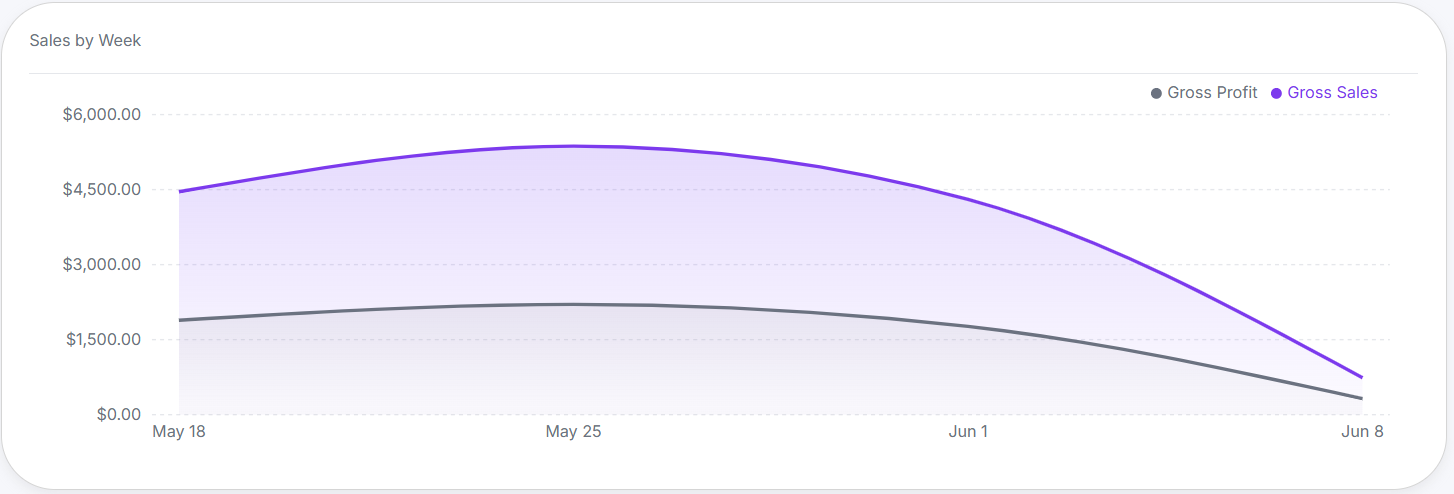
Sales by Week
Compare gross sales and gross profit over the last 4 weeks to understand revenue performance and profitability side by side. This view highlights how much of your sales are translating into profit, helping you quickly identify margin trends, cost impacts, and the effectiveness of pricing or discount strategies. Use it to make informed decisions that balance growth with profitability.
Low Stock
The Low Stock card highlights inventory items that are at risk of running out based on current stock levels and recent sales trends. It helps teams quickly identify and prioritize replenishment needs across locations.
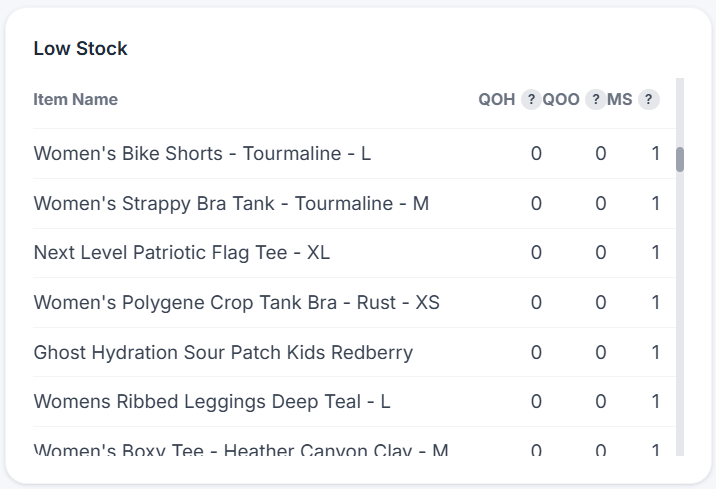
See below for a breakdown of what each column represents:
|
Column |
Description |
|---|---|
|
Item Name |
Name of the item that is low stock |
|
Quantity on Hand (QOH) |
Quantity of the item that is currently in stock |
|
Quantity on Order (QOO) |
Quantity of the item that is currently on order |
|
Minimum Stock (MS) |
Minimum quantity of item that should be in stock |
High Stock
The High Stock card highlights inventory items that are currently above typical demand levels, helping you identify overstocked products and optimize purchasing decisions.
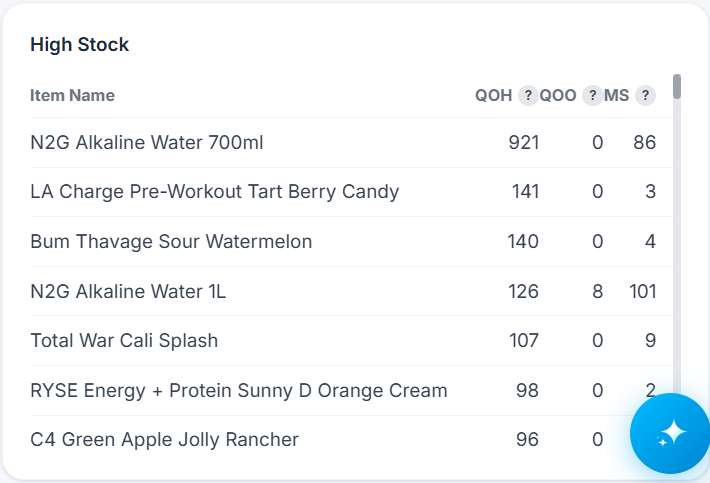
See below for a breakdown of what each column represents:
|
Column |
Description |
|---|---|
|
Item Name |
Name of the item that is high stock |
|
Quantity on Hand (QOH) |
Quantity of the item that is currently in stock |
|
Quantity on Order (QOO) |
Quantity of the item that is currently on order |
|
Minimum Stock (MS) |
Minimum quantity of item that should be in stock |